Royal proclamation of The 18th century.
Be Proclaimed
After the seven years war GB;
In British Columbia, the Royal Proclamation of 1763 created a unique—and often contentious—legal legacy. Because the Proclamation established that land could only be acquired by the Crown through formal treaties, it set a high bar for legal settlement that was largely ignored in BC for over a century.
Here is how that history unfolded in your region and across the province:
1. The “BC Anomaly”
While the rest of Canada followed the Proclamation’s rules (leading to the numbered treaties across the Prairies), BC took a different path. Aside from a few early agreements on Vancouver Island (the Douglas Treaties) and a corner of the northeast (Treaty 8), the colonial government mostly stopped making treaties.
* The Logic:
Colonial officials argued that the Proclamation didn’t apply to BC or that Indigenous title had already been extinguished. * The Reality: This left the vast majority of BC as unceded territory, meaning the land rights of Indigenous nations were never legally surrendered to the Crown according to the Proclamation’s own rules.
2. The Nicola Valley Context
In the South Central Interior, including the Nicola Valley, there were no historic treaties signed during the initial waves of settlement. * This created a long-standing legal “limbo.” * Local nations, such as the Nlaka’pamux and Syilx (Okanagan), have maintained for generations that their title remains intact because the protocols of the 1763 Proclamation were never followed.
3. The Rebirth of the Proclamation (1970s–Present)
The Royal Proclamation became the “secret weapon” for BC Indigenous nations in the 20th century. Because it was never repealed, the Supreme Court of Canada eventually used it to confirm that Aboriginal Title exists.
* The Calder Case (1973):
Acknowledged that title existed prior to colonization. * The Delgamuukw Case (1997): Confirmed that title is a right to the land itself, not just the right to hunt or fish on it. * The Tsilhqot’in Decision (2014): The first time the court granted a declaration of Aboriginal Title to a specific piece of land in BC.
4. Modern Treaty Negotiations
Because of the legal “gap” left by ignoring the Proclamation in the 1800s, BC is now the only province with a dedicated Modern Treaty Process.
* Instead of fighting in court for decades, the Province, the Federal Government, and First Nations are negotiating new agreements that define land ownership, resource sharing, and self-government.
* These modern treaties are essentially the 21st-century version of what the Royal Proclamation originally intended:
A clear, legal framework for how different people can live together on the same land.
Summary Table:
The BC Gap| Region | Status under Royal Proclamation | Result ||—|—|—|| Ontario/Prairies | Followed (Numbered Treaties) | Clear legal transfer of land (though often disputed in practice). || Coastal BC | Partially Followed (Douglas Treaties) | Small pockets of treaty land on Vancouver Island. || Interior BC | Ignored | Land remains largely “unceded”; modern negotiations ongoing.
British Columbia
In the Nicola Valley,
the history of land rights is a complex overlap of two distinct nations: the Nlaka’pamux and the Syilx (Okanagan). While the Royal Proclamation of 1763 established the rule that the Crown must sign treaties before settlement, that rule was famously ignored here, leading to the “unceded” status of the land you live on today.
1. The Nlaka’pamux Nation (The People of the Canyon)
The Nlaka’pamux (historically called “Thompson” by settlers) have lived in the Nicola Valley and Fraser Canyon for thousands of years.
* The Scw’exmx: In the Nicola Valley specifically, the Nlaka’pamux people are known as the Scw’exmx (“People of the Creeks”). This includes bands like the Lower Nicola Indian Band, Coldwater Indian Band, and Nooaitch Indian Band.
* Territorial Markers:
Their land rights are rooted in a deep physical history. The Lower Nicola Indian Band, for example, uses ancient petroglyphs and pictographs as legal “territorial markers” to prove their continuous presence and ownership under the principles of the Proclamation.
2. The Syilx Nation (The Upper Nicola Band)
The Upper Nicola Band (located near Douglas Lake/Quilchena) is the only Syilx (Okanagan) community in the Nicola Valley. Their presence here is a fascinating piece of diplomatic history: * The Fish Lake Accord: In the late 1700s—shortly after the Royal Proclamation was signed in London—the Syilx and the Secwépemc (Shuswap) ended a long period of conflict with a formal peace treaty.
* Land Grant:
As part of this accord, the Syilx were granted the territory around Douglas Lake. This shows that Indigenous nations were exercising their own “Proclamation-style” legal sovereignty and land transfers long before European law arrived in the valley.
3. The Shared Territory of Merritt
The City of Merritt officially recognizes that it sits on the traditional and unceded territory of both the Nlaka’pamux and the Syilx. * No Historic Treaty: Because no treaty was ever signed for this area, the legal “ownership” of the Nicola Valley remains a matter of ongoing negotiation.
* The “Joint” Reality:
Unlike other parts of Canada where one nation has a clear boundary, the Nicola Valley is a “shared” landscape where these two nations have intermarried, traded, and co-governed for centuries.
Local Governance GroupsToday;
These land rights are managed through several tribal councils and assemblies that represent the different bands in your area:| Organization | Represents | Focus ||—|—|—|| Citxw Nlaka’pamux Assembly | Multiple Nlaka’pamux bands (e.g., Coldwater, Nooaitch) | Land management and resource agreements (like the Highland Valley Copper mine). || Okanagan Nation Alliance (ONA) | The Syilx People (including Upper Nicola) | Asserting Syilx sovereignty and protecting the Nicola watershed. || Scw’exmx Tribal Council | Nicola Valley Nlaka’pamux communities | Social services, infrastructure, and title protection. |
The Modern Impact
Because the land is unceded, any major project in the Nicola Valley (like highway twinning or mining) requires deep consultation with these nations. They aren’t just “stakeholders”; according to the legal spirit of the Royal Proclamation, they are the underlying title-holders of the land.Would you like me to find more information on the specific “Fish Lake Accord” or how the Nlaka’pamux nations manage resource rights with local industries?
Fish Lake
The Fish Lake Accord and the resource agreements in the Highland Valley are two major pillars of land sovereignty in the Nicola Valley. One represents an ancient, Indigenous-led peace treaty, while the other represents modern economic and environmental power.The Fish Lake Accord:
A Sovereign Peace
In the late 1700s—completely independent of the British Royal Proclamation—the Syilx (Okanagan) and the T’kemlups Secwépemc (Shuswap) nations ended a period of war with a formal diplomatic agreement known as the Fish Lake Accord.
* The Land Transfer:
The Secwépemc granted the Syilx the territory in the vicinity of Douglas Lake. This is why the Upper Nicola Band is the only Syilx community in a valley otherwise surrounded by Nlaka’pamux and Secwépemc neighbors. * The Legacy: Today, the Upper Nicola Band uses the history of this accord to assert their “inherent jurisdiction.” It proves that Indigenous land rights in the Nicola Valley aren’t just something granted by the Canadian government; they are part of a pre-existing legal system that nations used to govern themselves and each other.Highland Valley: Resource Rights in ActionBecause the land in the Nicola Valley is unceded, the Highland Valley Copper (HVC) mine—one of the largest in the world—must operate through rigorous agreements with local nations. These aren’t just “handouts”; they are legal recognitions of Nlaka’pamux title.
1. The Citxw Nlaka’pamux Assembly (CNA)
The CNA was formed in 2013 to represent eight participating bands (including Coldwater, Nooaitch, and Shackan) in their dealings with the mine. * Economic Sharing: The CNA manages a Legacy Trust that invests mineral tax revenues and profits from the mine back into the communities.
* The “Guardians”:
They employ NLX Guardians, who act as “boots on the ground” to monitor water, wildlife, and environmental impacts independently of the mining company.
2. The Lower Nicola Indian Band (LNIB)
The LNIB has its own specific relationship with the mine, given its proximity to their Pipseul Reserve.
* Participation Agreements:
They have negotiated long-term agreements focused on procurement (hiring local Indigenous businesses) and employment.
* The Power to Say “No”:
These agreements often include “environmental working groups” where the nation has a direct seat at the table to set the terms for how the land will eventually be reclaimed and returned to a healthy state after the mine closes.
Comparison of Rights
| Feature | Fish Lake Accord | Highland Valley Agreements ||—|—|—|| Origin | Indigenous Diplomacy (Late 1700s) | Modern Legal Negotiation (2013+) || Parties | Syilx and Secwépemc | Nlaka’pamux Nations, BC, and Teck Resources || Primary Goal | Peace and Territory Definition | Revenue Sharing and Environmental Protection || Legal Basis | Inherent Sovereignty | Unceded Aboriginal Title
|Recent DevelopmentsAs of March 2026, there is active legal and political movement in the valley. Some nations, like the Spuzzum First Nation, have recently challenged the centralized power of tribal councils, seeking more direct control over their own resource contracts. This highlights that “land rights” in the Nicola Valley are still a very much alive and evolving topic.
Editors view
Annomily
BC is an anomaly and an unequal partner in the truth and reconciliation commission that reported more then a decade ago
Prehistory
The Nicola valley in the South Central interior British Columbia. Is particularly an issue and that probably hasn’t even been addressed. In the fact that it sits on a 7000-year-old late bottom. Evacuated at the end of the last ice age when the ice dam towards Spence’s bridge broke and an Aboriginal lifestyle of war, canoes and disputing groups were then now without lake and rapid transportation probably changed.
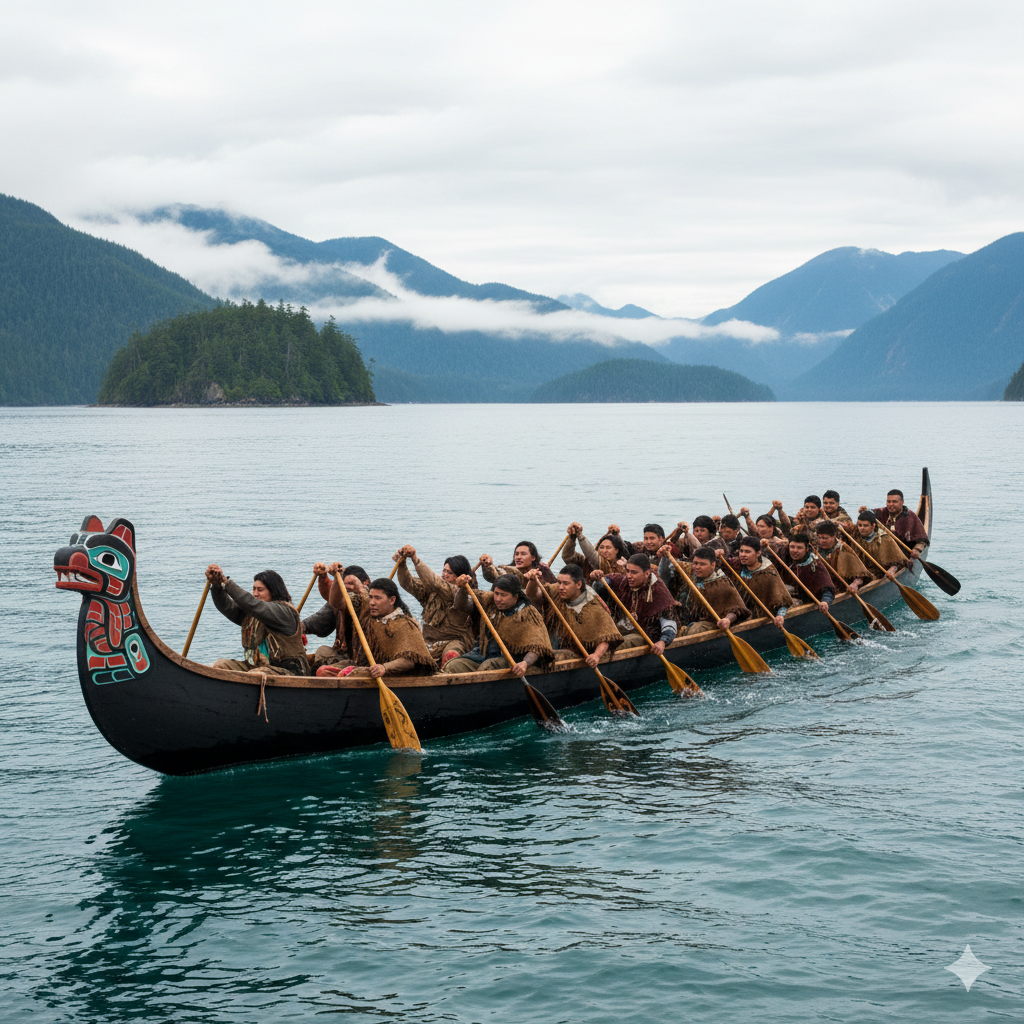
listening to Legends as a child from first Nations children. They often talked about canoes on the ancient lake which was the valley bottom. And waring tribes…
The view from the flagpole on the mountain on the highway 8 entrance to Merritt was confirmed as cougar valley below after the lakes had gone. This was done by oral tradition that was passed down to their children and we picked it up from their children.