spacex
Rah Rah
Eight dummy satellites deployed.
Data Success
According to sources they are happy with the data collected however it’s another space rocket exploded after the test, on landing, in the water, not unexpected.

To the seasons of life

Rah Rah
Eight dummy satellites deployed.
According to sources they are happy with the data collected however it’s another space rocket exploded after the test, on landing, in the water, not unexpected.
Saturday October 11th

The last day for the the farmers market in Merritt for this season. The group sets up every Saturday from 9:00 to 1:30 PM in the paved lot at 2250 Voght Street.

October 2025 KDG, TIC
The Nicola Valley Community Farmers Market is a vibrant hub for local agriculture and artisanal goods, typically held weekly during the warmer months. It brings together farmers, craftspeople, and community members, fostering connections and promoting the benefits of eating local. Visitors can find a variety of fresh produce, baked goods, handmade crafts, and unique food items, offering a delightful experience filled with the rich flavors and talents of the Nicola Valley region. The market also often features live music, workshops, and family-friendly activities, making it a cherished gathering place that supports local economy and sustainability.


Just next door to 2202 Voght Street in Merritt, Saturdays from 9:00 to 1:30 p.m. there is a farmers market. In the curling parking lot. Preferred access off Merritt Avenue. There are recreational opportunities with the Nicola Valley aquatic Center. Within walking distance is also the Merritt A&W and block and a half away. There is a new Valley graze for artisan prepared meals.
Welcome to Merritt.
The 120-year-old newspaper has resorted back to local ownership after being sold by a conglomerate of local newspapers:
Small publishing a valuable record.


The interest in all things lunar continues as mankind’s March to knowledge grows exponentially everyday.
Star ship 💥
The next Starship test flight, Flight 10, is scheduled for August 4th, 2025. This flight will be another uncrewed test to gather more data on the Starship’s performance.
Waiting for a crewed test launch, concerned about the Artemis Partner Program in the current geo political atmosphere it’s heartening to know a starship test is coming in August.
Maintained by space x that 1000 Starships will bring 1 million colonists to Mars. This I
Is for permanent settlement.
The ambitious goal of making Mars a habitable planet and sending a million people there is primarily driven by SpaceX, led by Elon Musk. While other space agencies like NASA have plans for human missions to Mars, SpaceX has the most public and aggressive timeline for large-scale colonization.
Here’s a breakdown of the key aspects of this program:
SpaceX’s Vision for Mars Colonization:
* Self-Sufficient City: The ultimate goal is to establish a self-sufficient, large-scale settlement and a democratic, self-governing colony on Mars. This means not just sending people, but building the infrastructure for them to live, work, and thrive independently of Earth.
* Starship System: The core of SpaceX’s plan is the Starship spacecraft and Super Heavy rocket. This fully reusable transportation system is designed to carry both crew and massive amounts of cargo to Mars.
* Massive Transportation: To achieve the goal of a million people, SpaceX envisions launching thousands of Starships during Mars launch windows (which occur approximately every 26 months). They talk about launching more than 10 times per day to maximize these windows.
* Phased Approach: The plan involves initial cargo missions to deliver equipment, habitats, and supplies before any humans arrive. The first crewed missions would focus on setting up propellant plants (to produce fuel on Mars using local resources), power systems, and rudimentary bases.
* Resource Utilization (ISRU): A crucial part of self-sufficiency is In-Situ Resource Utilization (ISRU). This involves using resources available on Mars, such as harvesting CO2 from the atmosphere and splitting it into its components to create oxygen and fuel.
* Timeline: While highly ambitious and subject to change, Elon Musk has spoken about a first crewed mission as early as 2029 and the development of a self-sustaining colony by 2050.
Terraforming Mars:
“Terraforming” refers to the hypothetical process of transforming a planet hostile to life into one that can sustainably host humans and other lifeforms without protection. While SpaceX’s immediate focus is on establishing a base that uses local resources, the long-term vision of a truly Earth-like Mars involves terraforming.
* Challenges: Terraforming Mars presents immense challenges with current technology. Key issues include:
* Thin Atmosphere: Mars has a very thin atmosphere with extremely low surface pressure.
* Lack of Magnetic Field: Mars lacks a global magnetic field, which makes its atmosphere vulnerable to erosion by solar winds.
* Cold Temperatures: Mars is very cold.
* Proposed Methods (Hypothetical):
* Greenhouse Gases: Releasing greenhouse gases (like CO2, which is abundant in Mars’s atmosphere and polar caps) to thicken the atmosphere and warm the planet.
* Artificial Magnetic Field: Creating an artificial magnetic field to protect the atmosphere from solar wind erosion.
* Engineered Dust Particles: Some researchers have proposed releasing engineered dust particles into the atmosphere to trap heat.
* Localized Habitats: A more achievable near-term approach might be creating localized habitable environments using materials like silica aerogel, which could provide shelter and warmth for small areas.
NASA’s Role:
While NASA doesn’t have a plan for colonizing Mars with a million people in the same way SpaceX does, they are actively working towards human exploration of Mars. Their goals include:
* Scientific Discovery: Understanding whether life ever existed on Mars, characterizing its climate and geology, and preparing for human exploration.
* Technology Development: Testing technologies for oxygen production (like MOXIE on the Perseverance rover), developing sustainable food and water systems, power generation, and advanced habitats.
* Artemis Program: NASA’s Artemis program is laying the groundwork for long-term human presence on the Moon, which will serve as a stepping stone and testing ground for missions to Mars.
In essence, SpaceX is the primary driver behind the “million people on Mars” goal, with their Starship system being the core technology. Terraforming, while a long-term aspiration, faces significant scientific and technological hurdles. NASA, meanwhile, is focused on incremental steps towards human exploration, scientific discovery, and developing the foundational technologies needed for future long-duration missions to the Red Planet.
Test number 10
Farm gate pricing can be a crucial component for supporting a family in British Columbia or Canada, but it’s often not sufficient on its own. Here’s a breakdown of the factors involved:
Farm Gate Pricing and Family Income:
* Potential for Higher Returns: Selling directly to consumers (farm gate sales) generally allows farmers to capture a larger share of the retail price, as they cut out intermediaries like wholesalers and retailers. This can lead to better margins per unit of product.
* Challenges to Viability:
* Scale and Volume: To generate enough income to support a family, a farm needs to produce and sell a significant volume of products. This requires substantial labor, land, and capital investment.
* Market Access and Demand: While direct sales offer better prices, farmers need consistent customer demand. This often means being located near population centers, investing in marketing, and building customer relationships.
* Off-Farm Income: A significant number of small-scale family farms in Canada, including BC, rely on off-farm income to supplement their farm gate sales and cover living expenses. This indicates that farm income alone is often not enough.
* Rising Costs: Farmers face increasing input costs (feed, fertilizer, fuel, equipment), high land values (especially in BC), and fluctuating market prices, which can squeeze profit margins even with direct sales.
* Labor and Time Commitment: Operating a successful farm with direct sales requires a huge time commitment, including production, processing, marketing, and sales. This can be challenging to balance with family life and other employment.
* Government Regulations: In BC, there are specific “Farmgate” and “Farmgate Plus” licenses for meat producers, allowing certain slaughter volumes for direct sales. This shows an attempt to support direct marketing, but there are still volume limits and other regulations to navigate.
Economies of Scale and Small Farms/Cooperatives:
* Traditional Economies of Scale: Historically, “economies of scale” in agriculture have favored large farms that can produce massive quantities at lower per-unit costs due to specialized machinery, bulk purchasing, and efficient distribution networks. This often puts small farms at a disadvantage.
* How Small Farms Can Achieve “Economies of Scope” or “Network Economies”: While true “economies of scale” (simply growing bigger to reduce per-unit costs) might be harder for individual small farms, they can achieve similar benefits through different strategies:
* Diversification (Economies of Scope): Small farms often diversify their crops and products. This allows them to spread risk, utilize resources more efficiently, and cater to diverse market demands, effectively creating multiple revenue streams from a similar asset base.
* Direct Marketing: Selling directly to consumers at farmers’ markets, farm stands, CSAs (Community Supported Agriculture), or online platforms helps small farms capture more of the retail dollar, effectively increasing their “scale” of profitability per unit.
* Value-Added Products: Processing raw agricultural products into higher-value goods (e.g., making jams from fruit, baked goods from grains, or prepared meals) can significantly boost revenue.
* Cooperatives and Economies of Scale: This is where cooperatives truly shine for small family farms. Cooperatives allow individual farms to achieve many of the benefits of larger-scale operations by:
* Bulk Purchasing: Buying inputs like seeds, fertilizers, and equipment collectively at discounted rates.
* Shared Equipment: Investing in expensive machinery that individual farms couldn’t afford on their own.
* Collective Marketing and Distribution: Pooling products to access larger markets, negotiate better prices, and streamline logistics (e.g., shared transportation, centralized storage facilities).
* Processing and Value-Adding: Establishing shared processing facilities to create value-added products that individual farms might not have the capacity for.
* Risk Management: Sharing risks associated with crop failure or market fluctuations.
* Knowledge Sharing: Members can share expertise and best practices, leading to improved efficiency and productivity.
* Access to Financing: Cooperatives may have better access to loans and grants than individual small farms.
* Increased Bargaining Power: Cooperatives give small farmers a stronger voice in the marketplace and with suppliers.
In Conclusion:
While farm gate pricing offers potential for higher returns, it’s often not enough on its own to support a family in British Columbia or Canada given the high costs and challenges of farming. However, when combined with strategies that mimic economies of scale, particularly through cooperatives and diversified direct marketing, small family farms have a much better chance of achieving economic viability and supporting a family. Cooperatives, in particular, empower small farms to collectively leverage resources and market power, providing a pathway to sustainable livelihoods in agriculture.
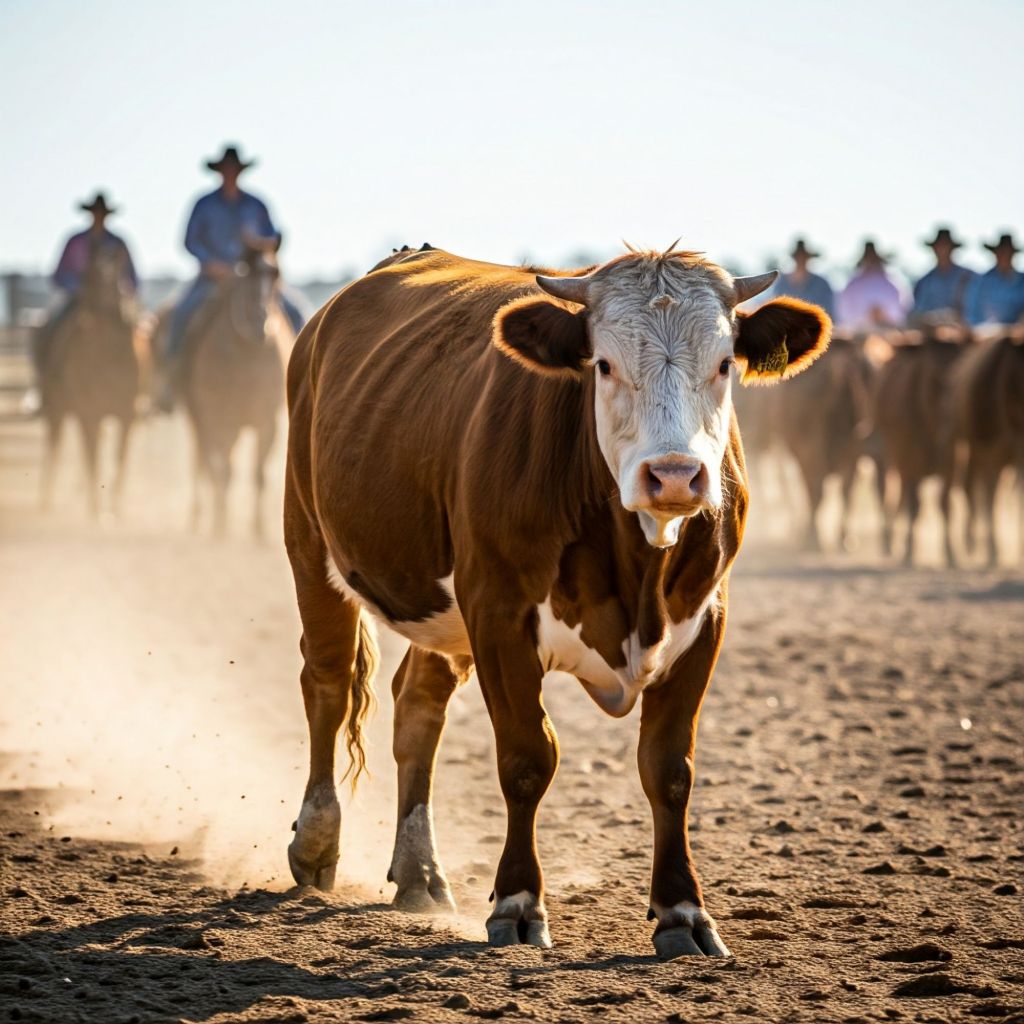
Australia is a major player in the global beef market, known for its high-quality grass-fed and grain-fed beef. The Australian red meat and livestock industry is a significant contributor to the national economy.
Here’s a breakdown of Australian beef production and its global comparison:
Australian Beef Production:
* Significant Industry: The red meat and livestock industry in Australia had a turnover of A$81.7 billion in 2022–23 and employed approximately 418,921 people.
* Production Volume: In 2023, Australia produced around 2.2 million tonnes (carcase weight) of beef and veal. In the March 2025 quarter alone, beef production increased by 4.9% to 709,140 tonnes. Forecasts suggest a further increase in production for 2025, potentially reaching 2.62 million tonnes due to anticipated destocking.
* Grain-fed Cattle: In the 2024 financial year, 2.8 million grain-fed cattle were marketed, a 4% increase from FY 2023.
* Cattle Numbers: As of June 2022, Australia had 24.4 million head of cattle (including dairy cattle).
Global Comparison – Production, Imports, and Exports:
Production:
* Global Standing: While Australia is a significant beef producer, its production volume is relatively small globally, accounting for less than 5% of the world’s beef and buffalo meat supply.
* Top Producers (2024/2025 estimates):
* United States: Leading the world with an estimated 12.29 million metric tons annually (around 20% of global production).
* Brazil: Second largest, with an estimated 11.85 million metric tons (around 19% of global production).
* China: An estimated 7.79 million metric tons (around 13% of global production).
* European Union: Collectively, about 6.63 million metric tons (around 11% of global production).
* India: Approximately 4.57 million metric tons (primarily buffalo meat).
* Argentina: Approximately 3.18 million metric tons.
* Australia: Around 2.58 million metric tons (approximately 4% of global production).
Exports:
* Major Exporter: Australia is a dominant force in global beef trade, ranked as the second-largest beef exporter in the world in 2024. In 2023, Australia exported 67% of its total beef and veal production, with a value of A$11.3 billion.
* Export Volume (2024): Australian beef export volumes reached 1.6 million tonnes in 2024, a 20% increase from the previous year. The total value of Australian beef exports in 2024 was £7.9 billion (approximately A$15 billion).
* Key Export Markets for Australian Beef:
* United States: Has been Australia’s largest market for exported beef for most of the last 25 years, accounting for 30.7% of Australia’s beef exports in 2024 (up from 17% in 2022).
* Japan: A consistent major trade partner.
* China: While China has historically been a significant market, Australian beef exports to China have seen volatility due to changing import protocols. However, China remains an attractive market for premium Australian beef products.
* South Korea: Another key market.
* Indonesia: Important for Australian beef exports.
* Global Export Landscape (2025 estimates):
* Brazil: Projected to be the largest exporter (3.6 million MT CWE).
* Australia: Second largest exporter (1.9 million MT CWE).
* India: (1.645 million MT CWE, mainly buffalo meat).
* United States: (1.179 million MT CWE).
* Argentina: (860,000 MT CWE).
Imports:
* Australia as an Importer: Australia generally has minimal beef imports, relying on its strong local supply. Occasional imports from New Zealand occur, typically during New Zealand’s peak beef production cycles. Very small quantities of high-end Japanese Wagyu beef are air freighted to Australia for top restaurants.
* Major Global Beef Importers (based on value in 2024 for fresh whole beef):
* United States
* Italy
* Germany
* Netherlands
* Japan
* France
* Chile
* South Korea
* United Kingdom
* Mexico
Key Characteristics of Australian Beef Production:
* Traceability and Integrity: Australia boasts strong paddock-to-plate traceability and product integrity systems, which are key selling points for food safety and sustainability.
* Quality and Reputation: Australian beef is globally recognized for its high quality, whether grass-fed or grain-fed.
* Market Diversification: Following trade challenges with China, Australia has actively diversified its export markets, strengthening relationships with other major importers.
In summary, Australia is a relatively smaller global producer of beef but a massive exporter, leveraging its reputation for quality and robust supply chains to compete effectively in international markets.

Free and fair trade is the normal default desirable position tariffs are often punitive and arbitrary.
https://youtube.com/shorts/2blNjxDa4pM?feature=share

Remember, taking up the small while being mindful of the large can help you navigate tasks and challenges with balance and purpose.

Is fishing back?
Based on the search results, here’s information regarding fishing licenses on the BC Coast:
Tidal Waters (Saltwater) Recreational Fishing Licenses:
* In the 2023 to 2024 season (April 1 to March 31), a total of 333,478 tidal waters sport fishing licenses were issued to residents of British Columbia. This includes various types of licenses such as annual, 5-day, 3-day, and 1-day for adults, as well as annual licenses for seniors and juveniles.
* For the 2022 to 2023 season, the total number of tidal water sport fishing licenses issued to BC residents was 302,179.
* Approximately 300,000 license holders participate in tidal recreational fishing in British Columbia.
* Juveniles (under 16 years old) are required to obtain a free tidal waters sport fishing license.
* A separate Salmon Conservation Stamp is required for anglers of all ages who wish to retain any species of Pacific salmon.
Commercial Fishing Licenses:
* The number of individual annual commercial license holders in the Pacific region has been declining. In 2023, there were 4,057 individual license holders, which is a 74% decrease from the peak in 1987.
* These individual license holders were issued a total of 5,512 species-specific commercial licenses in 2023.
It’s important to note the distinction between recreational (sport) fishing licenses and commercial fishing licenses, as they are managed and tracked separately. The data provided above gives a recent snapshot of the number of licenses issued for both categories on the BC Coast.

Hey Merit what do you say?

![]()
![Ebo Pepinensis [Philodromidae] 30x](https://live.staticflickr.com/65535/55416272699_ed6c9abbf5_s.jpg "Ebo Pepinensis [Philodromidae] 30x")

")


